 Currently, only the first series may be
clicked to drill down to the list of students who meet the criteria on the
dashboard widget. Multi-series drill down will be available in a future
beta.
Currently, only the first series may be
clicked to drill down to the list of students who meet the criteria on the
dashboard widget. Multi-series drill down will be available in a future
beta.
The Dashboard allows you to visually display data in the forms of ‘widgets’ that are used to help you evaluate the success of your agency in reaching current fiscal year state targets and NRS negotiated targets for enrollment and post testing. The dashboard widgets also allow you to ‘drill down’ to the list of students who need post tested or are not receiving instructional hours. Information for the widgets is pulled from raw data – not FY summaries – using a base set of queries.
The dashboard widgets do not run on selection, but run on current fiscal year students.
To display the Dashboard and select the widgets you wish to display, click the Dashboard menu area link.
When you click the Dashboard menu area link but no widgets have been selected, you will see the Widget Library list on the left side of the window, and a ‘welcome’ screen that gives you instructions for setting a widget. Once a widget has been selected the ‘welcome’ screen will no longer display.
Adding, editing, and removing a dashboard widget:
1. Click the Widget Library link.
2. Select a title from the widget library.
3. Widgets that require a parameter will display with the setting side first.
4. Once you have entered the parameter, click Save to display the widget. You may add the widget multiple times with different parameters.
5. To edit the parameter, click the gear icon on the widget.
6. To remove a widget, click the X in the upper right corner of the widget.
Currently, only the first series may be
clicked to drill down to the list of students who meet the criteria on the
dashboard widget. Multi-series drill down will be available in a future
beta.
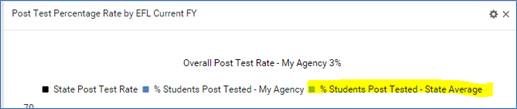
A series on a graph may be temporarily removed by clicking the legend on the dashboard widget graph. Clicking the legend again will add the series back to the graph. For example, the dashboard widget ‘Post Test Percentage Rate by EFL Current FY’ displays a series for ‘% Students Post Tested - State Average.’ Click the label in the heading to temporarily remove that series. Click the label again to display the series.
Once a dashboard widget displays, you may click a bar on the graph to drilldown to the list of students. A tile will display indicating the widget used to display the list. This tile cannot be edited.